Variable Zoo · Science · A Short History
A SHORT HISTORYFor most of human history the stars were the very emblem of permanence — fixed, eternal, unchanging. The story of variable-star astronomy is the story of the observers who proved that wrong, one patient measurement at a time. It runs from a single startled astronomer in 1596 to a billion-star catalog you can query in your browser today — and, remarkably, the thread that ties it together has always been people simply watching.
The heavens, disturbed
1572 – 1783 · the first variables
Aristotle taught that the heavens were flawless and immutable, and for two thousand years the sky seemed to agree. Then it didn't. In 1572 Tycho Brahe watched a brilliant new star blaze up in Cassiopeia — his De nova stella — and in 1604 Kepler saw another. These "new stars" (we now know them as supernovae) were impossible in a changeless cosmos, and they cracked the old certainty.
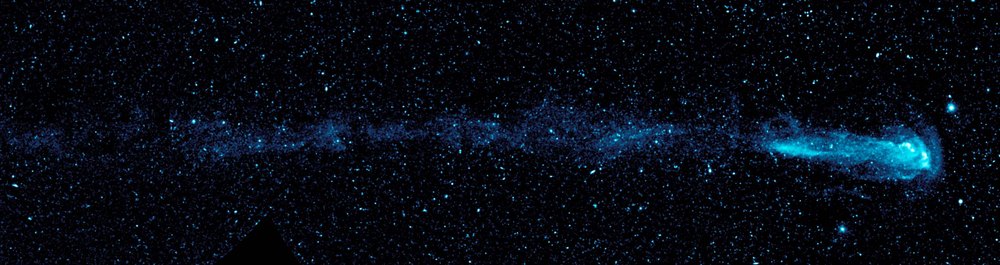
An even stranger surprise had appeared a few years earlier, in 1596, when the Frisian astronomer David Fabricius noticed a star in the neck of Cetus, the Whale, that slowly faded until it vanished. He took it for another nova — until, years later, it reappeared. Only in 1638 did Johannes Holwarda establish that it swells and dims on a roughly eleven-month cycle, and it earned the name Mira, "the Wonderful." It was the first star recognized to vary on its own, rhythmically, as a property of the star itself.
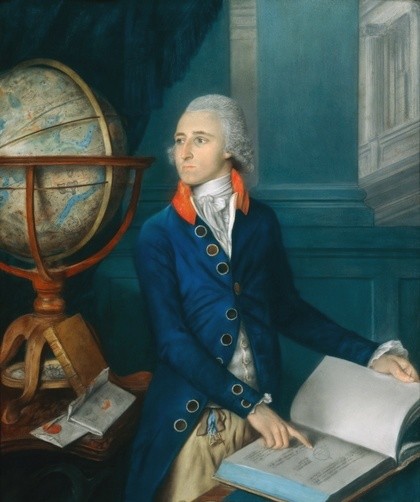
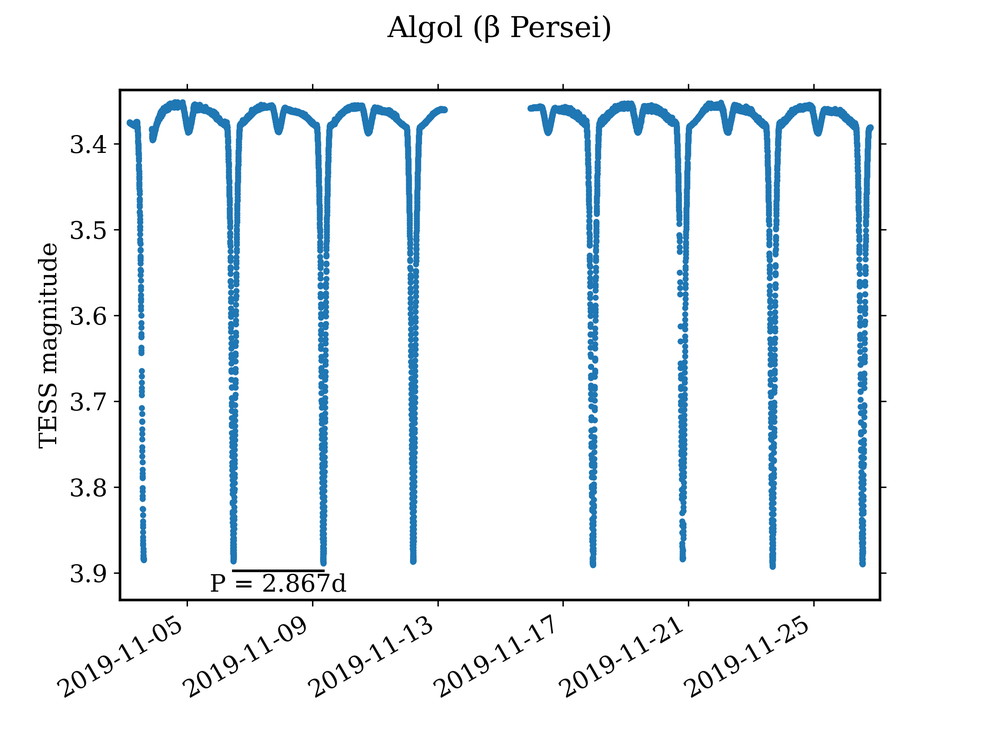
Then came a piece of pure deduction. The star Algol in Perseus dims sharply every few days, and in 1783 a young English observer named John Goodricke — deaf from early childhood, and still a teenager — proposed the astonishing explanation: that a dark companion was passing in front of it, eclipsing it, like clockwork (he offered it as one of two possibilities, the other a spotted, rotating star). He timed the period to within minutes. He was right, more than a century before Hermann Vogel confirmed that companion spectroscopically, in 1889. The Royal Society awarded him its Copley Medal; he died at twenty-one. The lesson of Algol still holds: careful, repeated observation of a single point of light can reveal a whole hidden world.
What Goodricke deduced, a satellite now records automatically. Below is Algol's brightness over a few days, measured by NASA's TESS spacecraft: the light holds steady, then plunges as the fainter companion slides in front of the brighter star — the deep, clockwork dip Goodricke explained by reason alone in 1783, more than two centuries before this curve was taken.
A ruler for the universe
1908 – 1929 · the cosmic yardstick
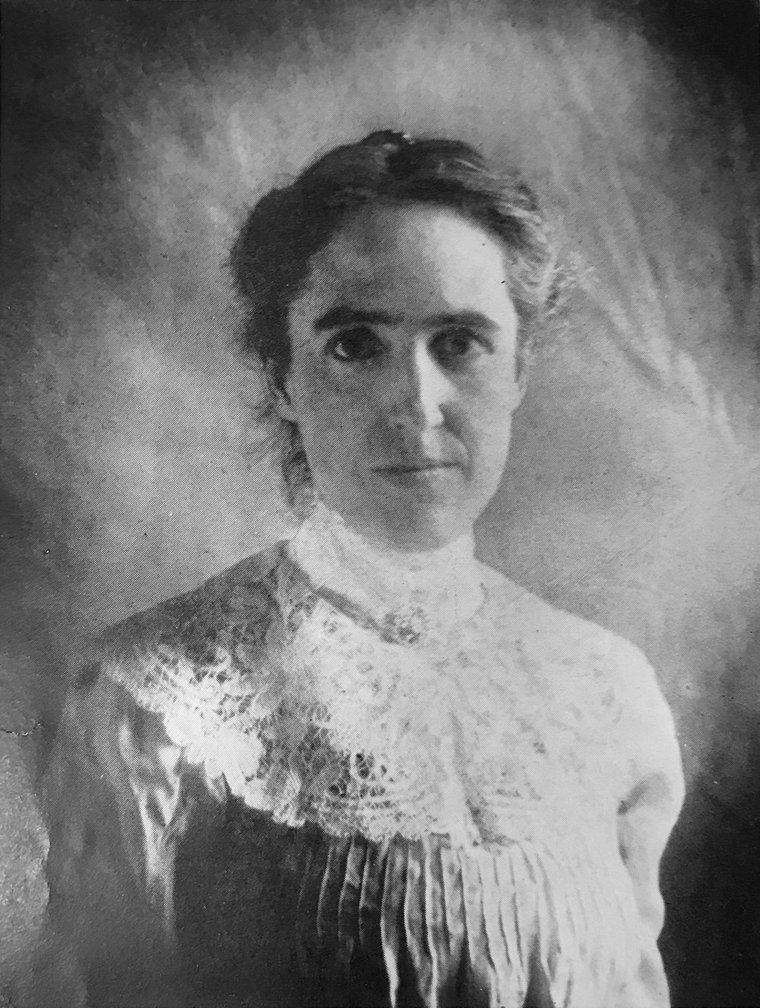
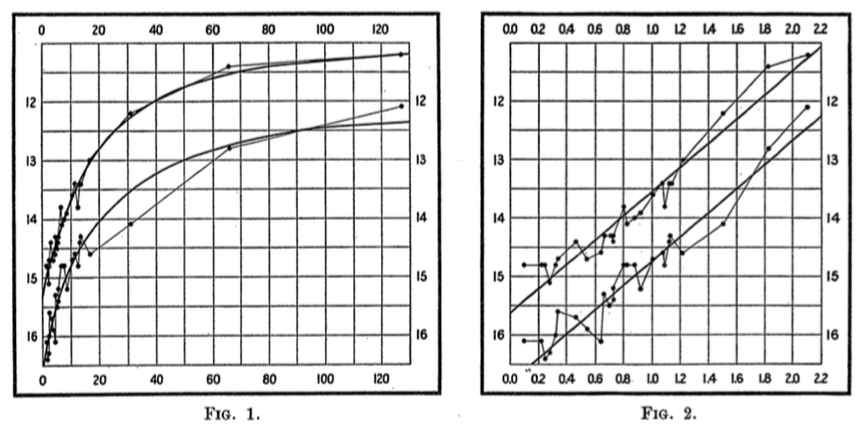
At the Harvard College Observatory around 1900, a team of women known as the "computers" catalogued hundreds of thousands of stars from glass photographic plates. Among them, Henrietta Swan Leavitt studied a class of pulsating stars — the Cepheids — in the Magellanic Clouds. Her breakthrough turned on a piece of good fortune: because those stars all lie together in the Small Magellanic Cloud, they are all at essentially the same distance from us — so differences in how bright they appear must reflect real differences in how bright they truly are. In 1912, from just 25 of them, she published a discovery of staggering reach: a Cepheid's pulsation period is tied directly to its true luminosity. Measure how fast one blinks, and you know how bright it really is; compare that to how bright it looks, and you know how far away it is. (The relation still needed one external rung — a true distance to a few nearby Cepheids — which others supplied within a decade.)
Within two decades Edwin Hubble used Cepheids to prove that the "spiral nebulae" were entire galaxies far beyond our own. Paired with the spectral redshifts that Vesto Slipher had painstakingly measured at the Lowell Observatory in Flagstaff, Arizona — showing that most of those galaxies are streaming away from us — Leavitt's yardstick revealed a universe that is expanding (Hubble, 1929). A humble class of variable star, patiently measured, had redrawn the size and history of everything. Time and again, this is the pattern: the changing sky is not a curiosity at the edge of astronomy but a lever at its center.
Citizen science
1911 – today · watching together
Professional telescopes are few and their nights are precious, but variable stars need to be watched continuously, for years, all over the sky — exactly the kind of vigilance a large community of dedicated observers can provide. In 1911 the amateur astronomer William Tyler Olcott, encouraged by Harvard's Edward Pickering, founded the American Association of Variable Star Observers (AAVSO).
What grew from it is one of the great achievements of citizen science in any field: a worldwide community of observers who, for well over a century, have contributed careful brightness estimates — built into a database of tens of millions of observations, freely available and still consulted by professional astronomers today. When a satellite needed to know how a cataclysmic variable had been behaving for the past forty years, the record was there because someone, somewhere, had kept watch. The AAVSO showed that ordinary people, organized and persistent, can do real and lasting science — a legacy that shaped this project's spirit directly.
A beginning
a personal note
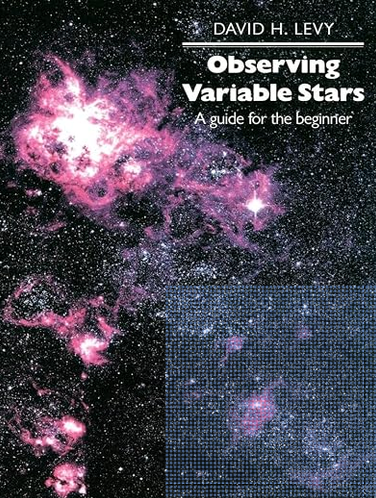
Every observer has a first door. Mine was this book. Long before there were CMOS cameras or online catalogs, I read David Levy's Observing Variable Stars: A Guide for the Beginner and learned that with nothing more than a modest telescope, a star chart, and patience, an ordinary person could contribute genuine data — estimating a star's brightness against its neighbors, night after night, and sending those numbers to the AAVSO.
Levy — a beloved popularizer and one of history's great comet hunters, co-discoverer of the comet that struck Jupiter in 1994 — introduced countless amateurs to the quiet thrill of watching a star change. That habit of looking up, and of taking careful notes on what you see, is the seed the rest of this page grows from.
Cover shown for reference. Observing Variable Stars: A Guide for the Beginner, David H. Levy, Cambridge University Press, 1989 (2nd ed. 1998).
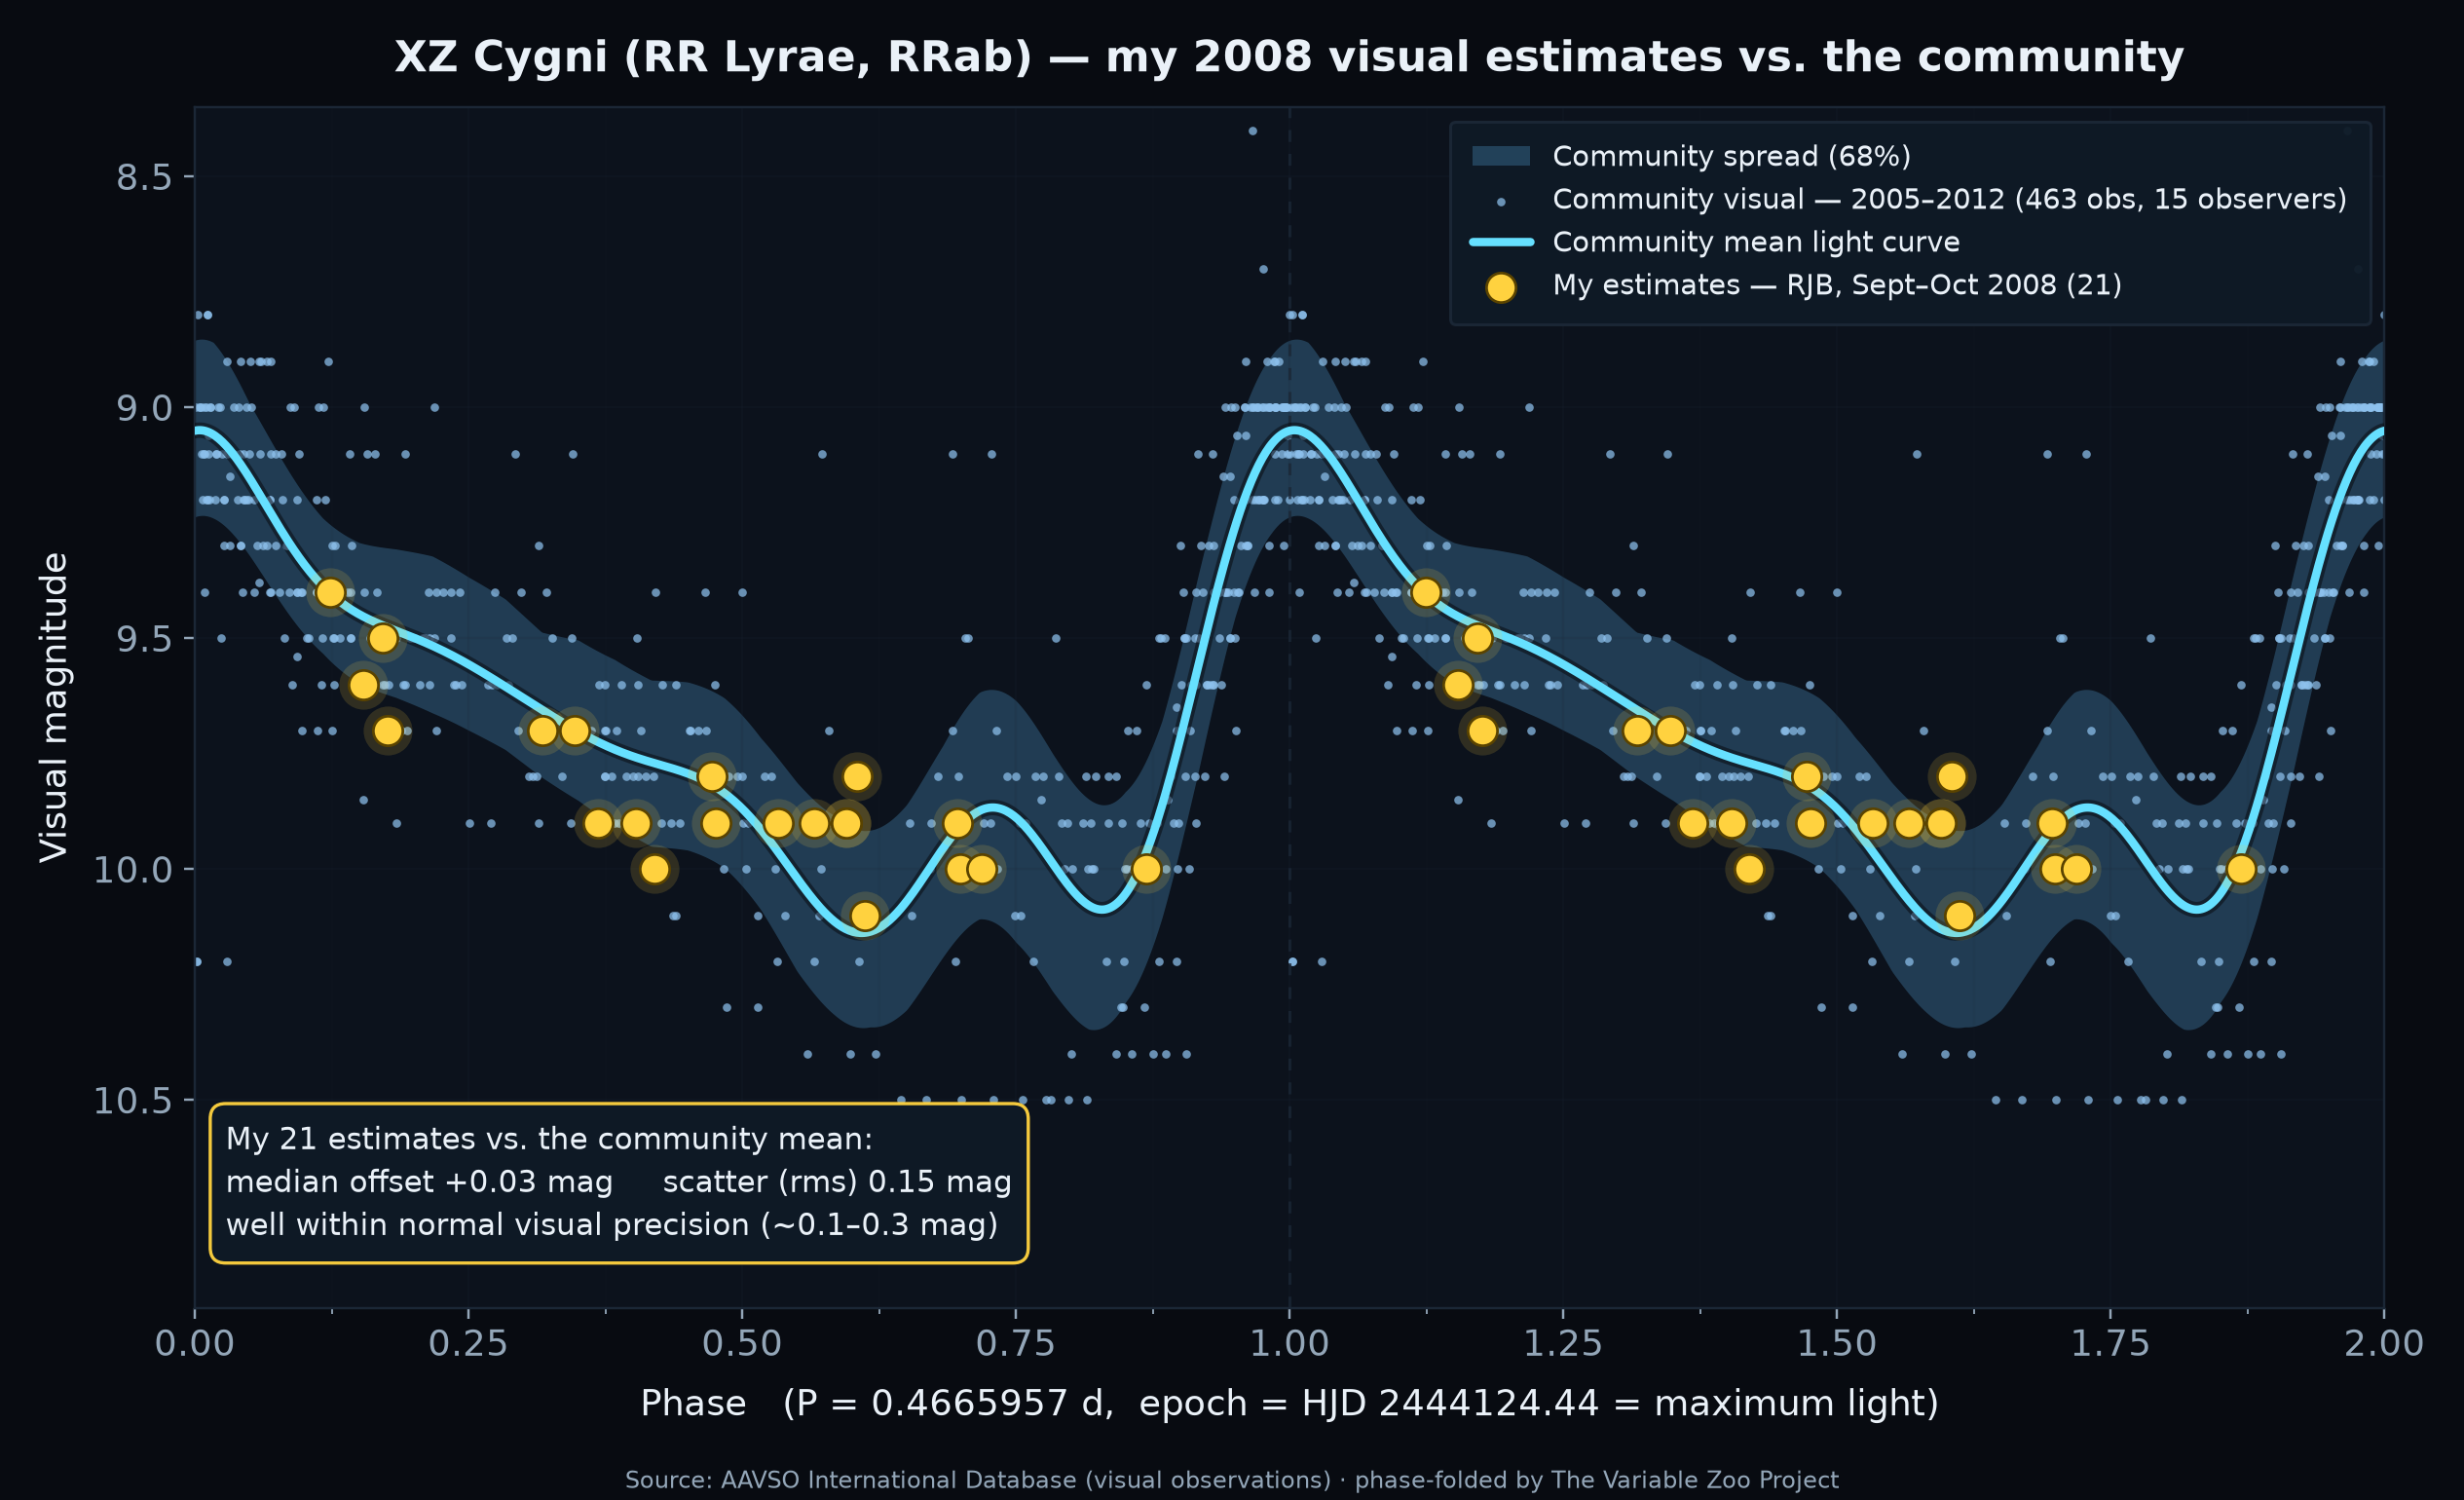
Not long after, I started watching them myself. In the autumn of 2008, with a Meade 10-inch Schmidt–Cassegrain set up in the backyard, I made 51 brightness estimates of fourteen variable stars and sent them to the AAVSO under the observer code RJB. Twenty-one of those nights were spent on a single, seemingly unremarkable star: XZ Cygni.
I had chosen XZ Cyg because I'd read something about the Blazhko effect — a slow, still not-fully-explained modulation that rides on top of an RR Lyrae star's half-day pulsation — and I wanted to watch it for myself. Night after night I would find the same faint speck in Cygnus, judge its brightness against the same handful of comparison stars, and write the number down. It is a strange and quiet intimacy: you come to know one anonymous point of light in a way you never expected to.
Years later, I can finally see how I did. Below are those 21 estimates, folded on XZ Cygni's half-day pulsation period and laid over the light curve the wider AAVSO community assembled from hundreds of visual observations of the same star. My points fall right on the communal curve — a median offset of about a tenth of a magnitude, well within what the human eye can honestly achieve.
Twenty-one estimates. It is a humble contribution — but it is real data, of exactly the kind that has carried this field for over a century. And it is the very thread this project pulls forward. Where in 2008 I logged a few dozen brightness estimates by eye, The Variable Zoo Project has now recorded more than half a million — over 528,000 individual photometric measurements — so far. The same impulse to watch the changing sky; roughly ten thousand times the reach.
The great surveys
2009 – today · the machine age of the sky
The turn of the millennium changed the scale of the game. Instead of pointing at one star at a time, new instruments began to monitor the whole sky, over and over, automatically — and the census of variable stars exploded.
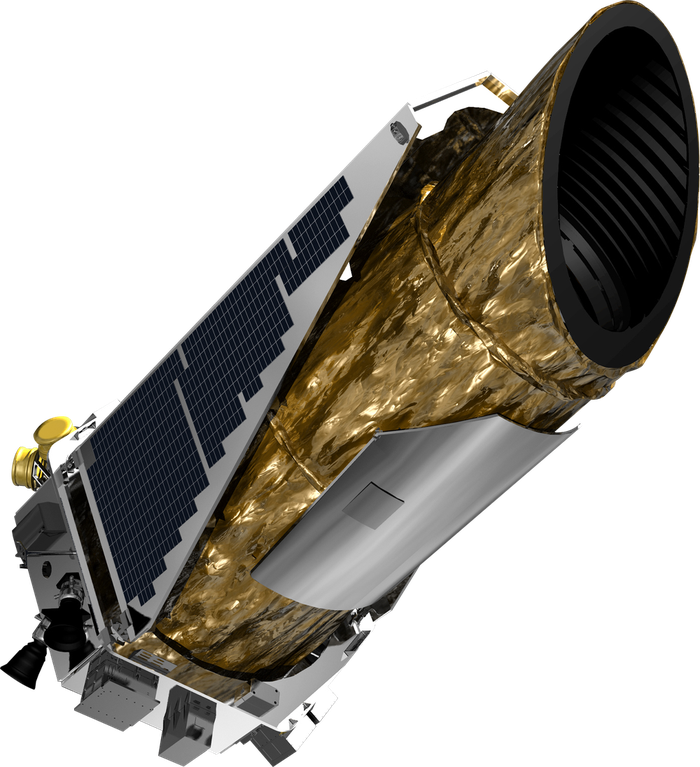
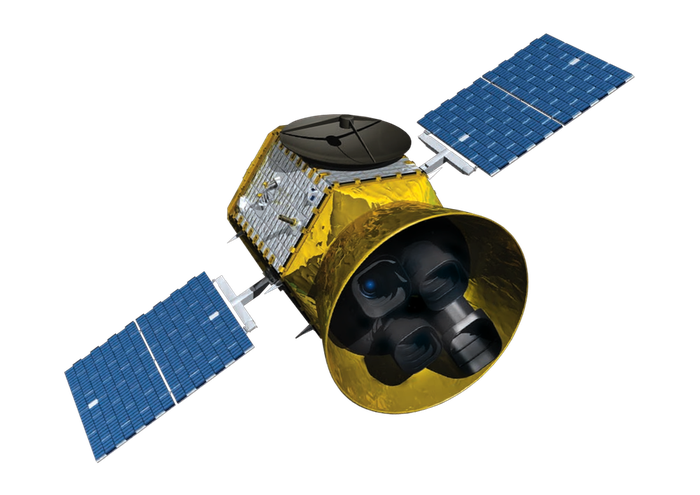
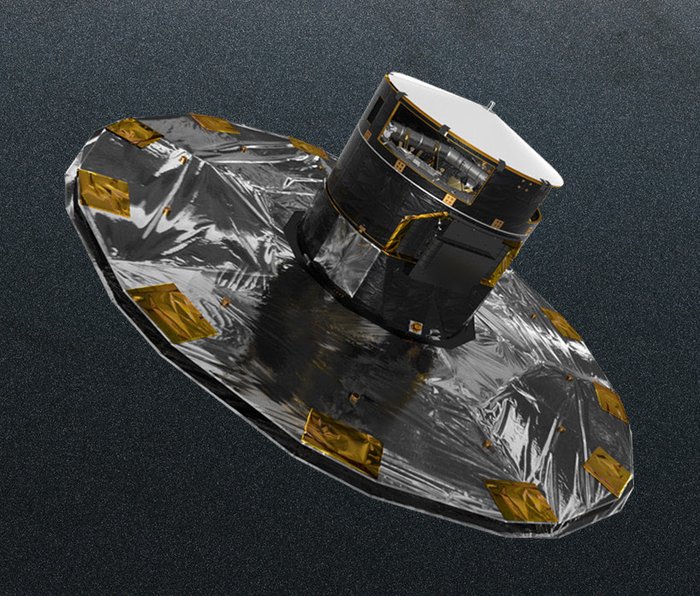
Between them, these surveys turned the known population of variable stars from thousands into the millions — the roughly ten-million-star catalog this project is built to explore. And they made something else possible: the data, the reference catalogs, and the software to use them are now largely open to anyone.
The present moment
now · your hands
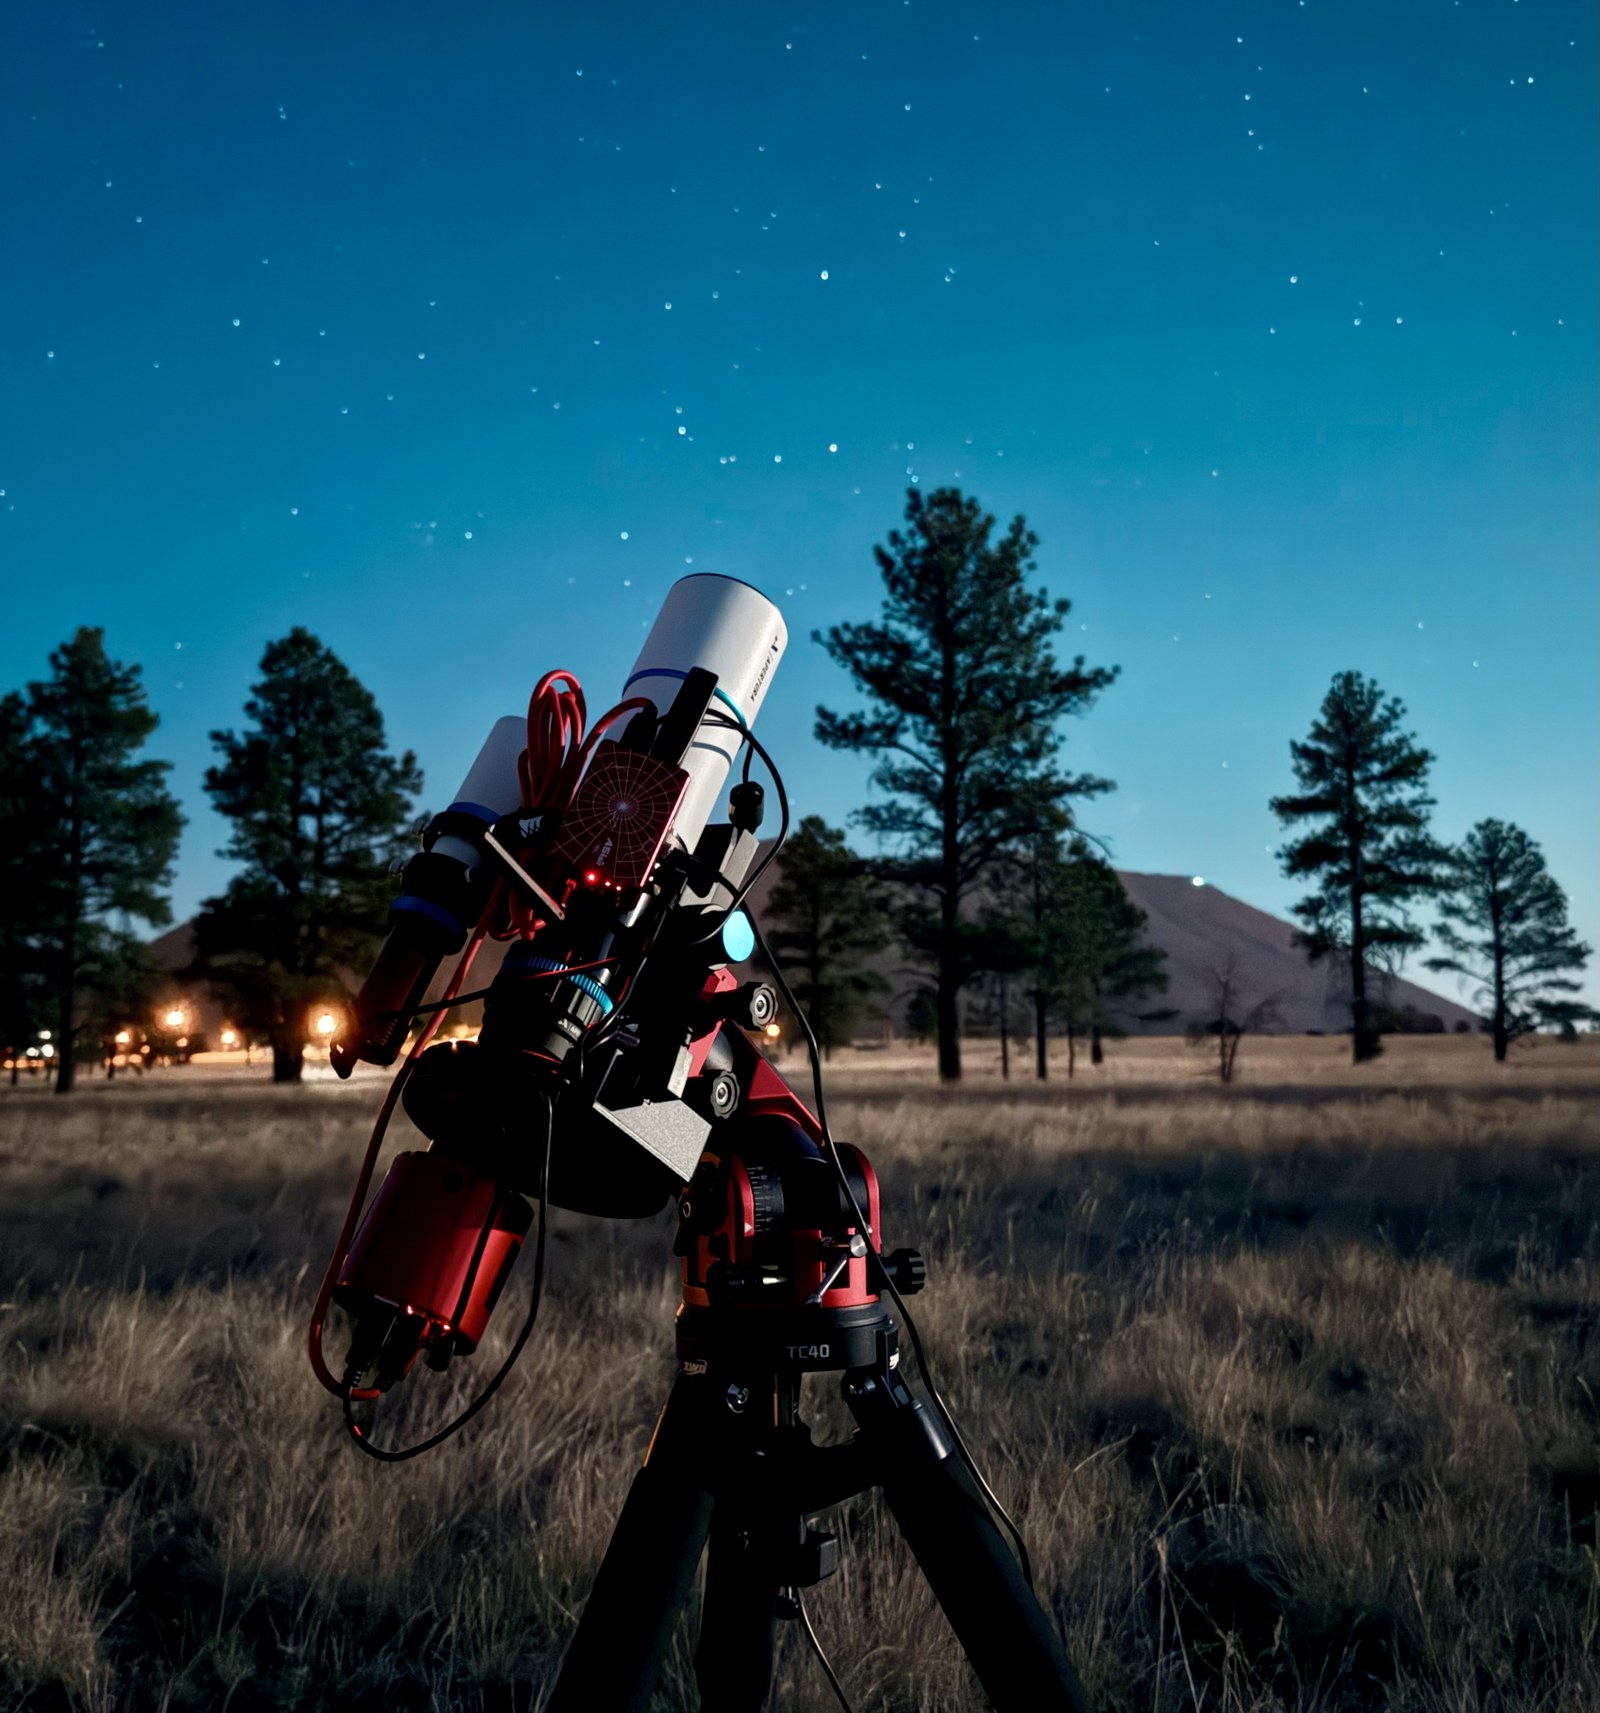
Here is the remarkable thing about this history: what has changed most is not the impulse — to watch the changing sky — but the reach of a single pair of hands. The instruments that once required an observatory and a staff now fit on a backyard mount. A billion-star reference catalog that once lived in a data center now streams into a web browser. Open pipelines and, increasingly, AI can turn a night of ordinary deep-sky images into calibrated, catalog-anchored measurements of thousands of stars at once.
That is the lineage The Variable Zoo Project belongs to — Fabricius's startled eye, Goodricke's careful timings, Leavitt's plates, a century of AAVSO observers keeping watch, the great surveys sweeping the heavens — all leading to a moment when the barrier to real contribution has never been lower. The sky is still changing. It has never been easier to look, or to measure what you see.
See how those changes look, star by star — explore the variable-star taxonomy, browse the interactive sky, or search the catalog of 10 million variables.
 Variable Zoo