A small-telescope survey of variable stars — stars that pulse, erupt,
and eclipse, and the exoplanets that cross them — built on an open pipeline that measures thousands at once against the
AAVSO VSX × Gaia catalog. Every line of code, every observing plan, and every
report here is developed in collaboration with Anthropic's Claude Code, making the
project a working showcase of what AI can do in a real scientific domain.
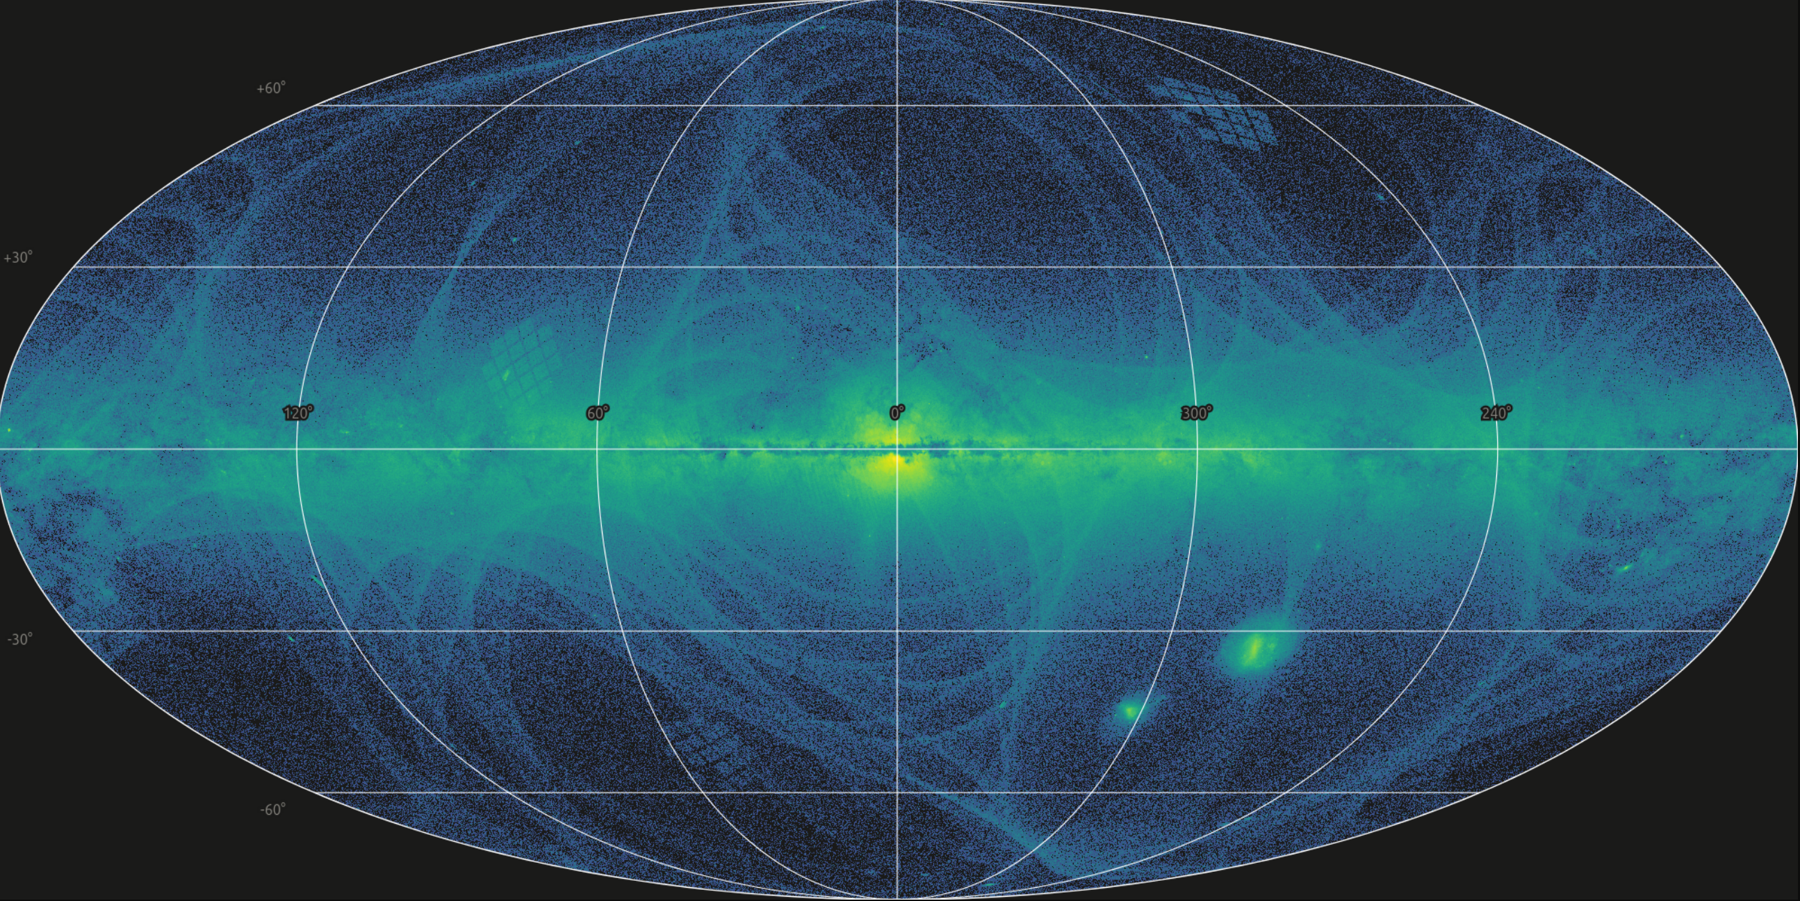
The whole variable sky — all 10.3 million stars in the AAVSO Variable Star Index,
in galactic coordinates. The Milky Way's plane glows across the middle, the Magellanic Clouds
hang below at right, and the faint loops trace how surveys like Gaia have swept the heavens.
Explore it interactively →
Most stars look fixed, but a huge fraction are variable: their brightness changes
over hours, days, or years. Those changes are a direct window into stellar physics — the
pulsation of dying giants, the tug of orbiting companions, the runaway fusion of a nova.
Long-baseline monitoring of these stars underpins the cosmic distance ladder and the whole
field of time-domain astronomy.
The Variable Zoo focuses on the objects a backyard telescope can follow well — especially
long-period variables and eruptive systems — turning ordinary deep-sky imaging into
quantitative, catalogued measurements.
On the evening of 9 July 2026, a small refractor no wider than a coffee mug
pointed at an unremarkable speck in the constellation Cygnus and started taking pictures,
one every half-minute, for six hours. The speck is called SS Cygni, and it is one of
the most famous variable stars in the sky. I expected to catch it dozing. Instead, I caught
it erupting.
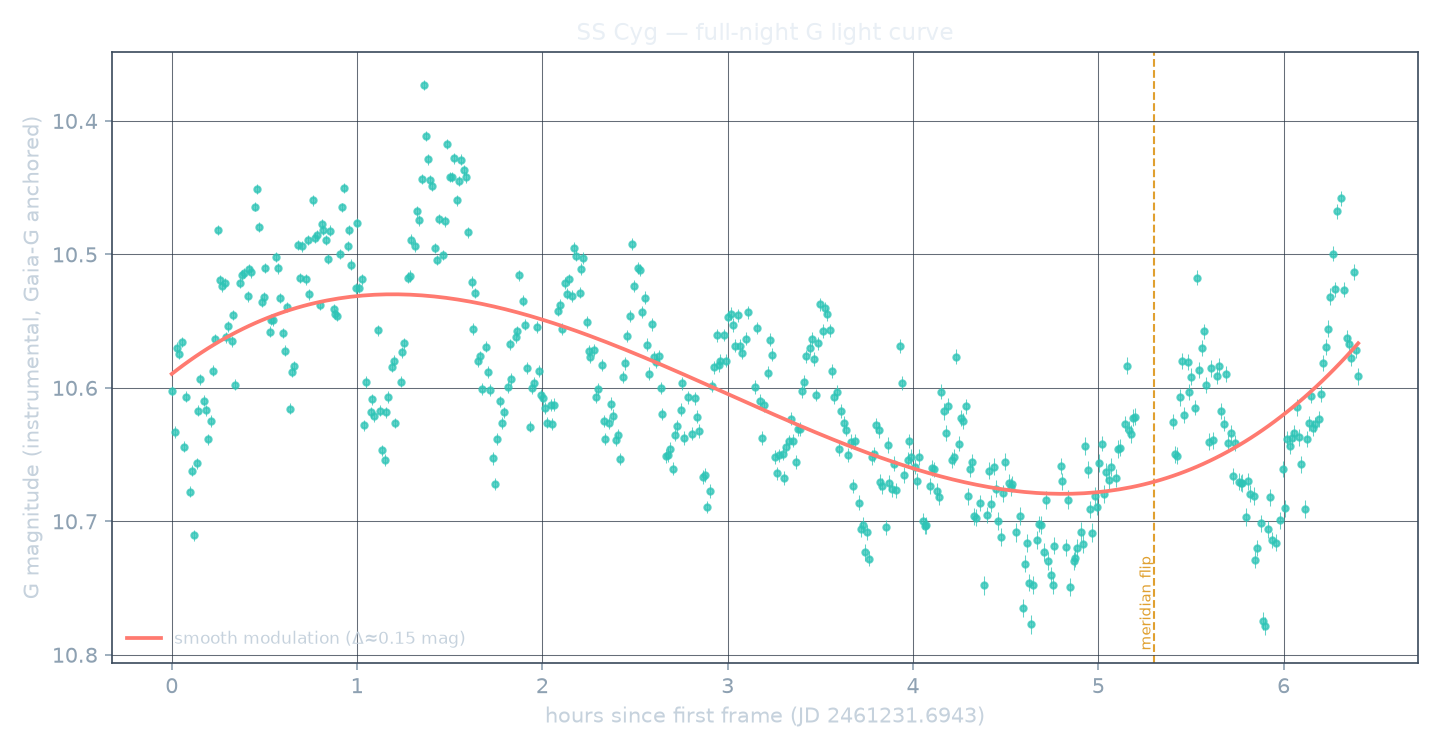
The real thing — SS Cygni across a single 6.4-hour night. Every teal point is
one 30-second frame our pipeline measured and anchored to Gaia G; the coral curve traces a
slow ~0.17-mag modulation riding on the fast flicker of its accretion disk. This is exactly the
kind of measurement the Variable Zoo turns ordinary deep-sky imaging into.
Read the story →
Source: The Variable Zoo Project
Stellar Diversity
Where each animal lives
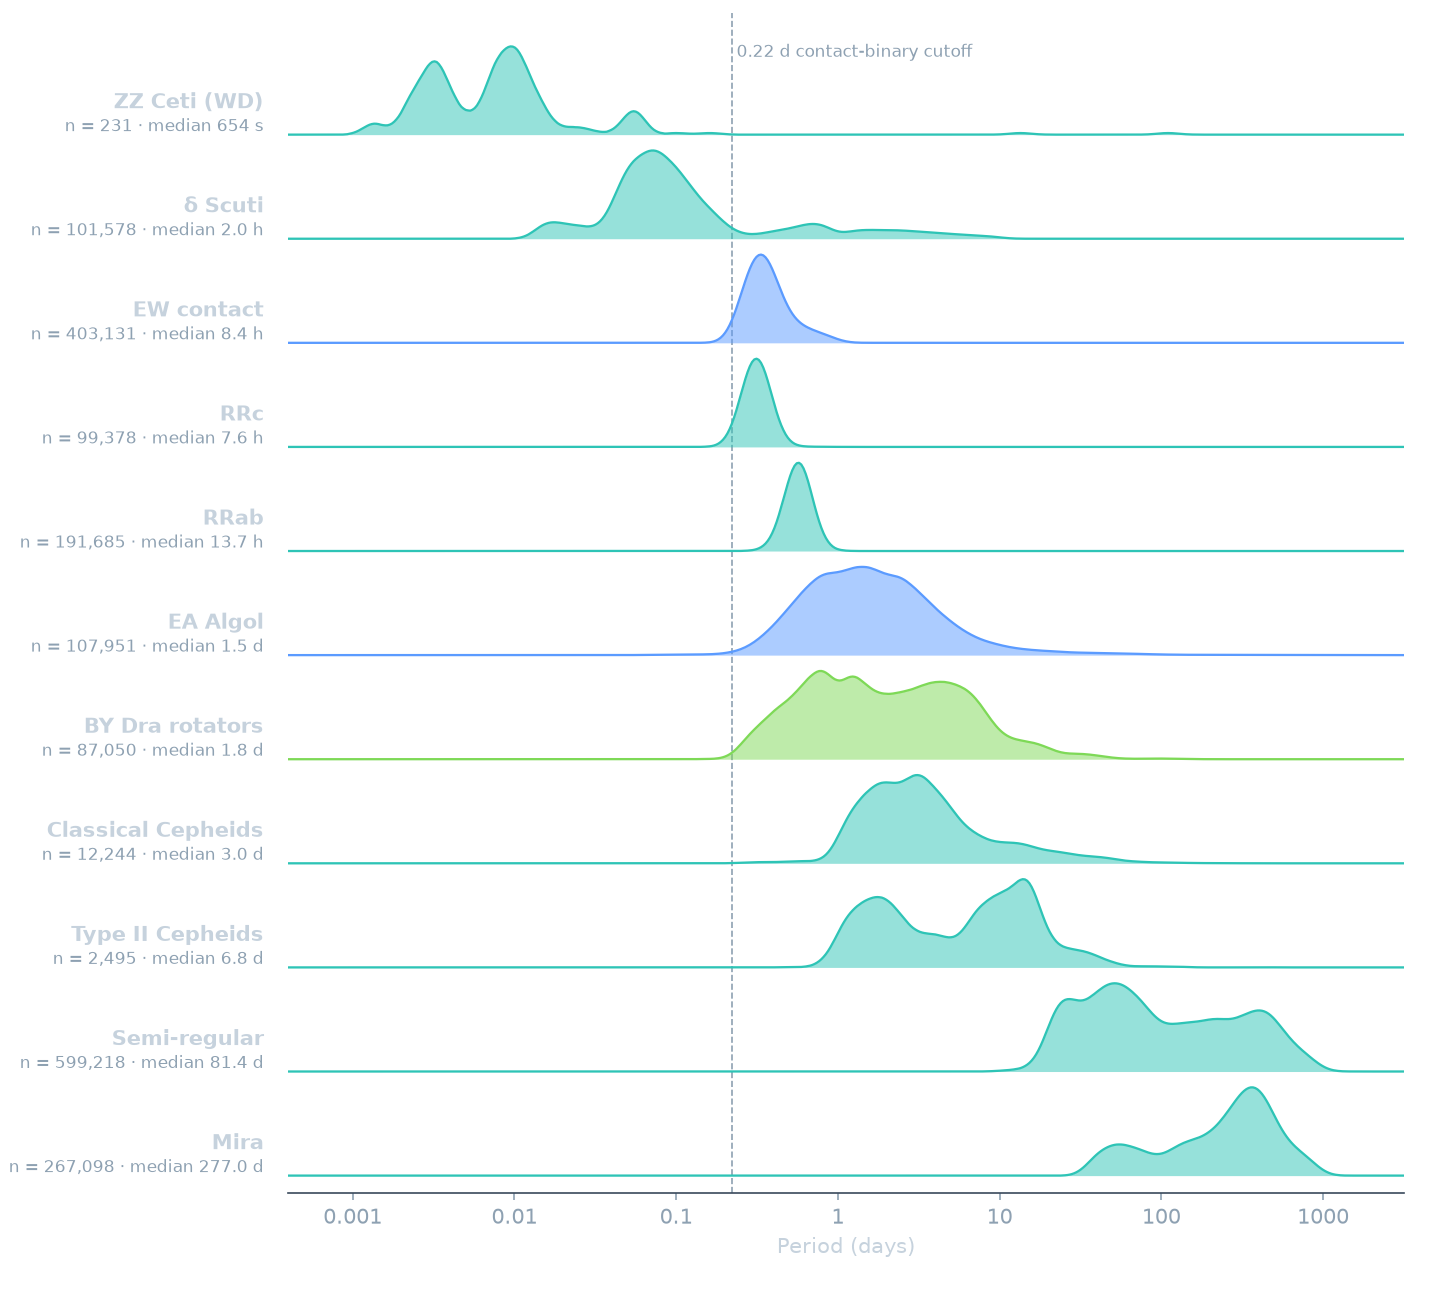
Every family keeps its own hours. Here are the periods of 1.87 million
catalogued variables, split by type — from the minutes-long pulsations of white dwarfs at left to the
thousand-day breaths of Mira giants at right. The sharp edges are physics: the 0.22-day floor of
contact binaries, the narrow RR Lyrae strip set by the horizontal branch. Colour marks the
mechanism — teal pulsating, blue eclipsing, green rotating.
The Menagerie
A zoo of variable stars
Stars vary for many reasons — pulsation, eclipses, starspots, cataclysmic
outbursts. Each leaves a distinctive light-curve signature. These are the "animals" of the
Variable Zoo; our survey aims to measure and monitor them across wide fields of the sky.
Learn
more about variable-star taxonomy →
Small astrophotography rigs at Lowell Observatory, an open photometry pipeline, and a
half-billion-star reference catalog.
01 · CAPTURE
Wide-field imaging
A 60 mm refractor and a 17-inch PlaneWave record thousands of stars per frame,
each field plate-solved against Gaia DR3.
02 · MEASURE
Ensemble photometry
Every source is matched to the AAVSO VSX catalog and measured differentially,
anchored to Gaia G — no per-star calibration needed.
03 · CATALOG
Light curves & folds
Measurements fold onto catalog ephemerides and accumulate into a growing database
of observations across many variability classes.
Results
Variable Zoo Library
⚠ Research & development — not peer-reviewed. The documents below
and the entire photometric pipeline are AI-generated. Neither the software nor the results
have been peer-reviewed or validated by the scientific community. The Variable Zoo Project is a
research-and-development effort in its earliest stages, and we make no claims as to the
scientific validity of any observation or measurement presented here.
Three ways into the data — an all-sky map of the reference catalog, our own survey
measurements, and a full catalog search — each running right in your browser.
The Variable Zoo is, deliberately, a demonstration of AI-driven
scientific research. The photometry pipeline, the plate-solving, the analysis, the observing
plans, and the reports on this site were all developed in a sustained collaboration with
Anthropic's Claude Code. We are up-front about this because we think it is the point:
a working example of what human–AI partnership can accomplish in a real scientific domain.
28,100+lines of code
85programs written
11web pages generated
—days since we began
100%AI-generated
The human
Sets the scientific direction and the questions that matter, runs the telescopes,
provides domain judgment, and decides what is real and what is worth pursuing.
The AI (Claude Code)
Writes and debugs the pipeline, derives astrometry and photometry, runs the analysis,
drafts the plans and reports, and builds this site — under continuous human review.
About
About the project
The Variable Zoo Project is led by Dr. John Rachlin, Associate Teaching Professor at
the Khoury College of Computer Sciences, Northeastern University, and an avid
astrophotographer who volunteers as a telescope operator at Lowell
Observatory's Giovale Open Deck Observatory in Flagstaff, Arizona. Reach him at [email protected].